A demo using Ably, Mapbox and data from CT Transit
This demo covers how to visualise public transport on a map in realtime. It uses the Ably Realtime Hub, which is a free collection of realtime data sources. For this demo we'll be using the CT Transit GTFS realtime channel. This is a realtime data stream which has been ingested and redistributed by the Ably Hub to make it easy to use and reliable.
This demo uses:
MapBox - A cross platform mapping tool
Mapbox allows us to build a fully customisable, interactive map. Their APIs and SDKs are free and well maintained.
MapBox and React
This demo uses the react-map-gl package (not to be confused with other similarly named packages that also wrap Mapbox). This package provides react components for Mapbox to do half of our work for us. The demo was started with Create React App which allows us to get quickly set up with a modern web app with no build configuration.
In order to use the react-map-gl package you will need an access token from Mapbox, which you can create with a free Mapbox account. Set your new access token to the REACTAPPMAPBOXACCESSTOKEN environment variable in the .env.local file.
Building a web app
The aim of this demo was to show an interactive map with live markers showing buses which update their position in realtime. Users will be able to select a bus to find out more data about it.
Create react app provides us with the following directory structure:
├── README.md
├── node_modules/
├── package.json
├── public
│   ├── favicon.ico
│   ├── index.html
│   └── manifest.json
└── src
    ├── App.css
    ├── App.js
    ├── App.test.js
    ├── index.css
    ├── index.js
    └── serviceWorker.js
public/index.html is the page template; src/index.js is the JavaScript entry point. src/App.js is our main react component and we will add Map.js and Geocode.js components.
Map.js explained
This is the component which adds a map to the page and manages the placement of bus markers.
In it we:
- Create state on start-up, with an empty dictionary of active buses
- Set up the map viewport
- Draw a map with react-map-gl
When the component mounts we:
- Subscribe to the Ably CT Transit channel
- Add a callback to put any published vehicles data from Ably into a dictionary
- Subsequent messages for a vehicle overwrite its entry, updating its position
- Updates will trigger React to rerender because our vehicle dictionary is in the state
Unfortunately the buses are jumping rather than moving smoothly. Animating the markers with react-map-gl turned out to be difficult for the following reasons:
- There are many, many buses in the dataset
- The data doesn't arrive in batches, it arrives in single bus events
- Because of that, animating could lock up other bus arrivals unless we batched the animations.
- This unfortunately required a lot of code, for not much difference in UX because they don't move far quickly!
The animations were removed to reduce complexity, but it would certainly be worth exploring this further in future, perhaps in a non-react version of the demo.
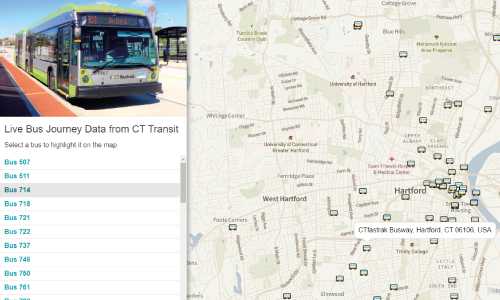
Demo Sidebar with bus information
The sidebar is a list populated with the names of the buses which have been published on the CT Transit channel. The list items are linked to the bus markers on the map. Clicking on a bus name will pan and zoom to that bus on the map.
Sidebar and Bus interactions:
- Clicking on bus name in the sidebar will pan and zoom to correct bus on the map
- Clicking on a bus marker will zoom into that bus
- The sidebar will only show buses which are within the bounds of the map
- Hovering over a bus will highlight the bus name in the sidebar
- Hovering over a bus will show a tooltip with that bus' address
Another unfortunate discovery about the react-map-gl component is that animated panning to specific markers doesn't work as expected. This may be due to the fact that the React component does not mirror all of the functionality of MapboxGL JS.
The flyTo and setCenter methods seemed to render a new layer onto the map which then disappeared as soon as the user tried to zoom or move the map, creating a jarring UX. It also didn't take the markers into account when animating, so they appeared to be in the incorrect position while the animation took place.
Luckily, we can cause a pan/zoom by setting the map viewport in the state, thus triggering the component to update.
Geocode.js Explained
The data returned by the CT Transit channel does not include human readable addresses, which would likely be helpful to those looking up bus positions. In order to provide this data we will have to use a geolookup API to convert the provided LatLong values into an address. For this demo we use the Google Maps API.
Using the Google Maps API
We use the google-maps npm package. We pass it the LatLong and are returned an address. It is rate limited to 50,000 usages per hour which means that we can only really use it on interaction, or there are too many requests and subsequent requests get ignored. To get around this problem we only call the API on hover of a bus marker rather than getting the data for every single bus as their data arrives. Wrapping the Google maps package in some promises so that we could use async/await makes it easier on the calling code, because we're not dealing with callbacks from the Google SDK in our own code.
Adding tooltips
In order to show the address of the buses on hover of the markers, the demo shows a 'tooltip', this is a div which displays just above the bus being interacted with. This came with its own difficulties too. The markers are absolutely positioned on the page by Mapbox. Which means that the tooltips cannot be placed inside the markers (which would be the simplest way to have them appear in the correct place on the page) as the z-index positioning of subsequent buses would place them on top of the tooltip, making it unreadable. Luckily, when Mapbox creates markers it places them with CSS transforms, therefore, on hover of a marker we can:
- Get the transform of the parent
- Apply it to the tooltip
- Show the tooltip
Marker and Tooltip interactions:
- On mouse enter of a marker add 'hover' flag in state with bus details
- Call Google Maps API with bus LatLong
- Add returned address to Tooltip body
- Set position of tooltip with position of marker
- Display the tooltip
- On mouse leave, remove 'hover' flag from state; hiding the tooltip
Conclusion
The combination of the Ably Hub realtime transport data and interactive mapping works very well to create a clear and compelling demo. While the example uses CT Transit, other transport data sources could integrate in similar ways, with a similar UX to this example. Similar demos could also be used by logistics companies to create some really great consumer facing visualisations.